

New figures released by GlobalData show that the construction project pipeline in eastern Europe is healthier than that of any other region, while in sub-Saharan Africa the industry is struggling to meet deadlines.
Eastern Europe has a score of 0.91 in GlobalData’s November 2021 Construction Project Momentum Index, which provides an assessment of the health of the construction project pipeline at all stages of development from announcement through to completion.
Every construction project in GlobalData’s database is assigned a score of between 5 and -5 based on its current progress, a score which is continually updated over time. These are then weighted by the value of each project in order to come to overall scores for countries, regions and sectors.
Within eastern Europe, the industrial sector has performed particularly well, with a score of 1.01, ranking second out of all 11 regions. By contrast, the region’s institutional sector has performed less well, ranking eighth with a score of 0.55.
Of all the countries in eastern Europe, the construction sector is healthiest in Poland, which has a score of 1.17 in GlobalData’s Construction Project Momentum Index.
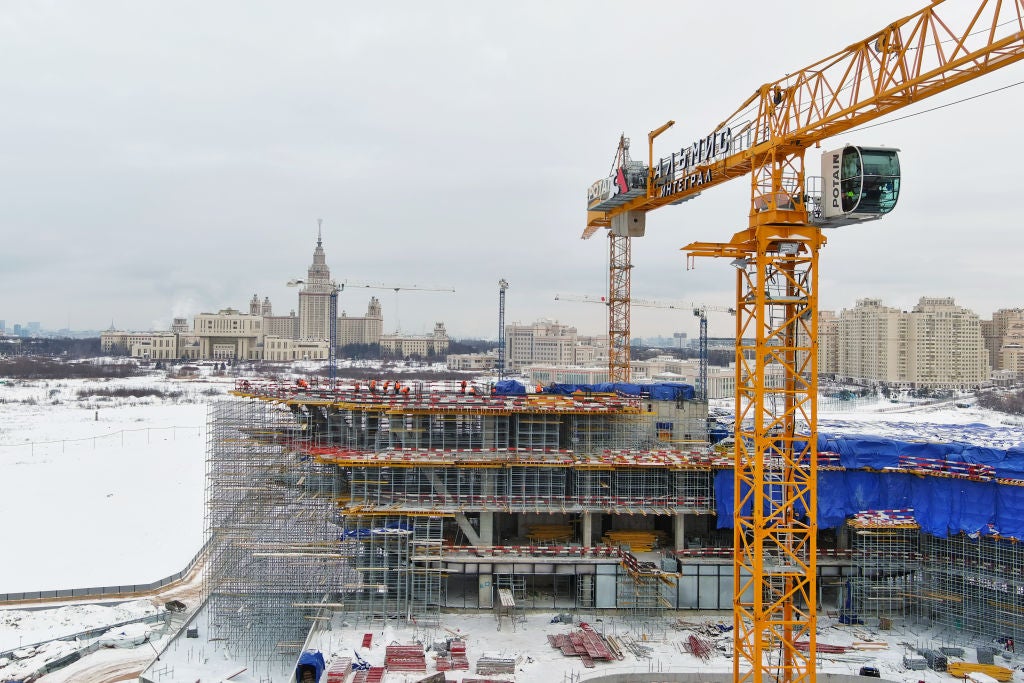
Ukraine (1.04) and Russia (0.96) have also performed well, whereas Bulgaria (0.18) is underperforming compared with the rest of the region.
Which regions are struggling?
While the construction sector in eastern Europe may be thriving, in sub-Saharan Africa the situation is less positive. Sub-Saharan Africa has a score of just 0.33 in GlobalData’s Construction Project Momentum Index, indicating frequent project delays and cancellations.
The situation is particularly severe in South Africa, which scores just -0.07 on the index. Ethiopia (0.23) also scores poorly. The situation is somewhat better in Nigeria, the best-performing country in sub-Saharan Africa with a score of 0.91.
Looking at construction projects by industry, sub-Saharan Africa’s difficulties are greatest in the industrial sector, which scores just -0.39 on the index. That puts sub-Saharan Africa in 11th place out of 11 regions in terms of the health of its industrial sector construction projects. The infrastructure sector performs somewhat better, scoring 0.95.
How are different sectors performing worldwide?
GlobalData’s analysis examined construction projects in six sectors around the world: energy and utilities, commercial and leisure, industrial, institutional, residential and infrastructure.
For construction projects in the energy and utilities sector, western Europe is seeing the healthiest performance with a score of 0.91 on GlobalData’s Construction Project Momentum Index. By contrast, North America has the worst score for projects in this sector at just 0.02.
Looking at projects in the industrial sector, north-east Asia is the best-performing region with a score of 1.11, whereas sub-Saharan Africa is the worst-performing region with a score of -0.39.
Investors looking to avoid delays and cancellations while constructing residential buildings should be looking to eastern Europe, which comes out top of the Construction Project Momentum Index in this sector with a score of 0.99, while steering clear of Latin America (0.24).
Infrastructure projects, meanwhile, have been running most smoothly in sub-Saharan Africa (0.95), while meeting the greatest friction in western Europe (-0.01).
In the commercial and leisure business, construction projects are currently seeing fewest delays in western Europe (0.92) and the most delays in sub-Saharan Africa (-0.13).
GlobalData also examined the progression of construction projects in the institutional sector, finding that they were proceeding most successfully in China (1.3) and least successfully in Latin America (0.13).
The Construction Project Momentum Index
GlobalData’s Construction Project Momentum Index is based on analysis of thousands of individual construction projects around the world.
Each project is continually monitored for updates, with updates indicating progress increasing the project’s score while updates indicating delays or cancellations reduce the score. The score always sits between 5, the best possible score, and -5, the worst.
The scores for individual projects are then weighted based on their significance in order to create combined indices for each region or sector.
Events that can reduce a project’s score include the project being cancelled or put on hold, delays, the rejection of applications or tender bids, or the reducing of the project’s scope.
Events that can increase a project’s score on the index, by contrast, include the completion or commencement of construction, the awarding of major contracts, or the approval of applications.


